
Chart building web app
Published | Project
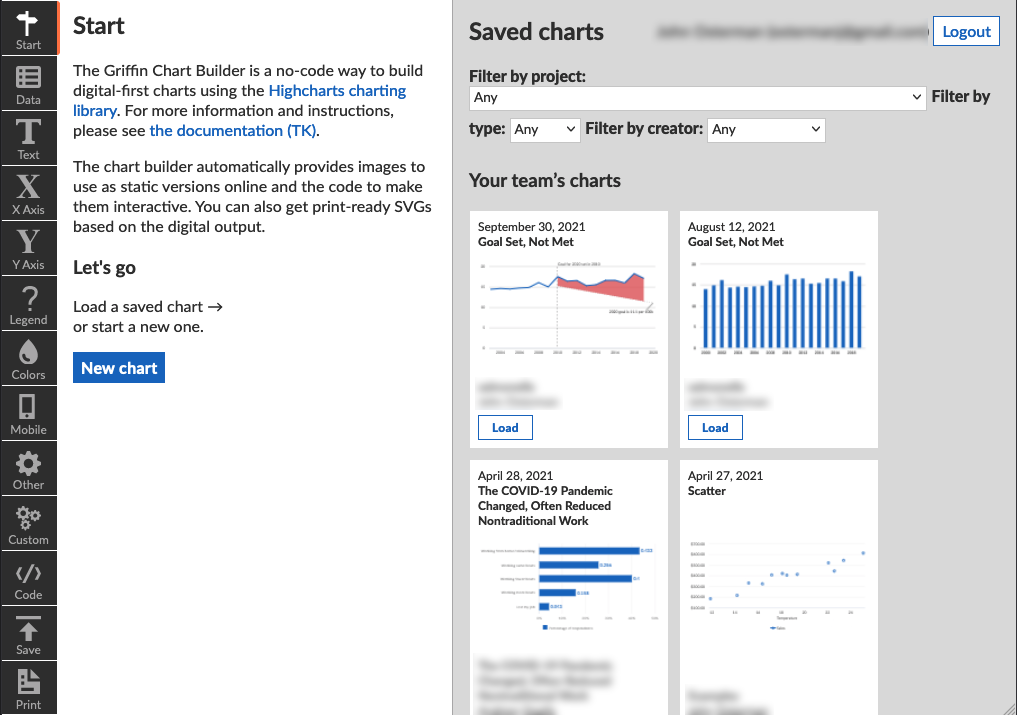
This is a web app for people with no coding experience to build interactive charts for the web. The charts are built with Highcharts; the graphical user interface transforms settings into the JSON configuration Highcharts needs to render them on the web.
But there’s more. One persistent challenge in publishing for the web—a theme central to my work for more than ten years now—is that orgs are also publishing for print (or at least for PDF). That means that each asset, like a chart, actually needs several: one for print and potentially multiple for the web, for different screen sizes and resolutions. That usually means a lot of time sunk keeping versions in sync with one another.
This tool solves that problem for charts. The charts are digital-first, optimized for all screen sizes by virtue of Highcharts’ responsiveness, but they can be exported as SVGs for use in print at whatever size the designers need. The print options are separated from the web version, but they all share the same source. Update one and you update the other. That translates to huge time savings.
There are off-the-shelf solutions not too different from this but none cross the print-web divide like this.
What else does it do?
- Users can log in through Google and save their work. Others can take that work and edit or publish it.
- Web charts can easily be static images or interactive Highcharts.
- Branding and other specs are enforced effortlessly.
- Advanced users can enter custom JSON configurations to extend and override standard settings.
I built this for Pew and we’re trying to roll it out. (Changing processes is hard.) Under the hood, though, this tool could be used by anyone by specifying brand colors, fonts, and other specs.