
Interactive dashboard of Philadelphia’s post-COVID economy
Published | Project
This was one of my last projects while at Pew and one of the hardest. While most of my projects were purely front-end pursuits with static data, this dashboard required a back-end database, serverless functions, and some data preprocessing in Node.
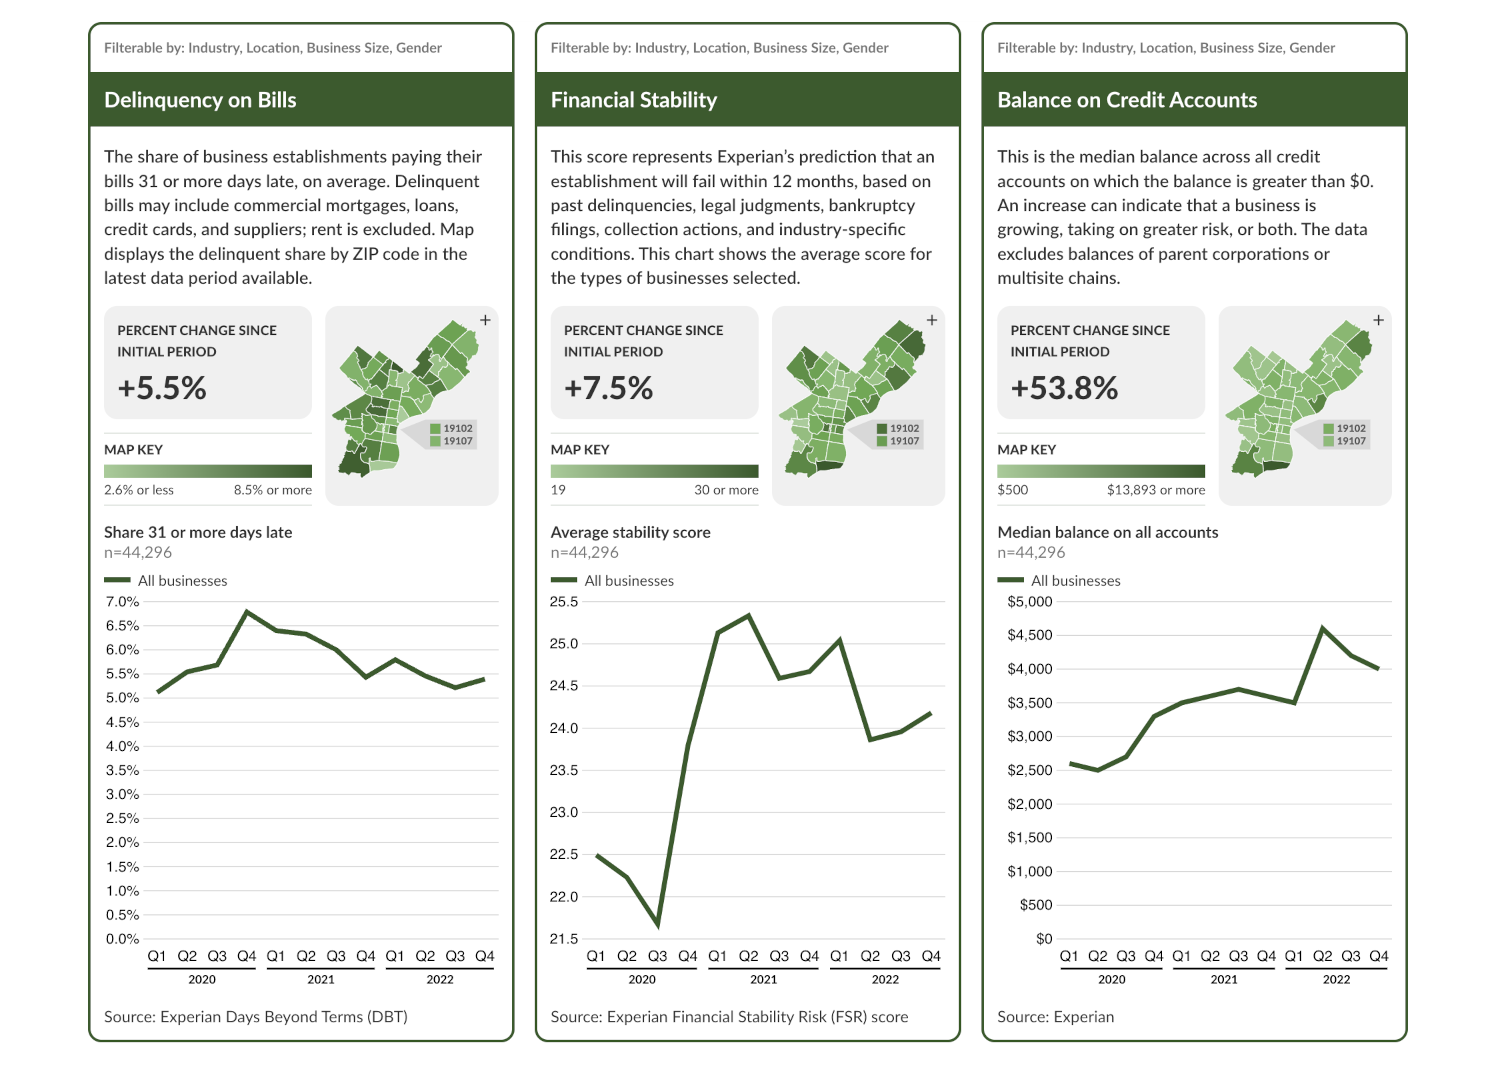
The goal was to chart Philadelphia’s economic recovery coming out of the Covid pandemic. My colleagues on the research side secured a large handful of data sources, some public and some proprietary, to make it possible. They handed off to me mostly clean datasets for each indicator:
- delinquency on bills
- financial stability
- balance on credit accounts
- work locations
- sales by sector
- bankruptcy filings
- jobs by sector
- jobs by establishment size
- hourly wages by sector
The back end and preprocessing
I needed a database to store this data in. The datasets were too big to wrangle on the client side, and I had to keep potentially identifiable individual data points from being exposed to the front end. (For the same reason, the display of some data is redacted if the number of businesses making up the average falls below a threshold because of the filters applied.) The database could have been anything; I ended up using MS Azure Cosmos DB.
All the datasets are put into the dataset (created or updated) by API using some NodeJS scripts. The first three datasets, proprietary data from Experian, are sent to the database basically as-is with the addition of precalculated aggregates. When filters are applied, a serverless function queries the database for matching entries and recalculates the result on the fly. Other datasets have far fewer filters available; each filter option is precalculated before being added to the database.
The front end
I built the front end with Svelte wrapped up by Webpack. There’s some D3 in there. The build step prerenders the page so that the static dashboard appears immediately on page load. JavaScript then rehydrates the app and provides the interactivity—good for core web vitals and SEO.